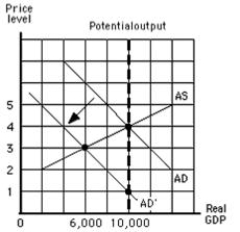
The figure below shows the aggregate demand and supply curves for the U.S.In this figure,which of the following might cause a shift in the aggregate demand curve from AD to AD'?
Figure 5.3
A) An increase in household wealth
B) A fall in domestic interest rates
C) An increase in government spending
D) An appreciation of the dollar relative to other currencies
E) A decrease in the nation's money supply
Correct Answer:
Verified
Q90: Which of these economic changes was observed
Q94: The concept of "invisible hand" introduced by
Q95: According to Keynes,the adoption of an expansionary
Q98: According to John Maynard Keynes' General Theory
Q99: The Keynesian approach to government economic policy:
A)has
Q110: If the government of a country owes
Q111: The figure below shows the aggregate demand
Q113: The figure below shows the aggregate demand
Q117: The figure below shows the aggregate demand
Q119: The figure below shows the aggregate demand
Unlock this Answer For Free Now!
View this answer and more for free by performing one of the following actions

Scan the QR code to install the App and get 2 free unlocks

Unlock quizzes for free by uploading documents