The figure below shows the aggregate demand and supply curves for the U.S.In this figure,as the aggregate demand curve shifts from AD to AD',the equilibrium price level in period 1:
Figure 5.2
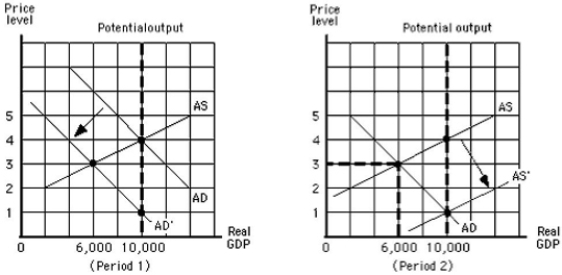
A) increases from 3 to 4.
B) decreases from 4 to 3.
C) decreases from 4 to 1.
D) increases from 1 to 4.
E) decreases from 4 to 2.
Correct Answer:
Verified
Q83: The Employment Act of 1946:
A)guaranteed full employment.
B)allowed
Q86: According to Keynes,if private sector demand is
Q91: According to Keynes,in order to get the
Q94: The concept of "invisible hand" introduced by
Q96: The Keynesian approach to fiscal policy calls
Q98: According to John Maynard Keynes' General Theory
Q99: The Keynesian approach to government economic policy:
A)has
Q113: The figure below shows the aggregate demand
Q116: The figure below shows the aggregate demand
Q118: The term "fine-tuning the economy" implies:
A)making government
Unlock this Answer For Free Now!
View this answer and more for free by performing one of the following actions

Scan the QR code to install the App and get 2 free unlocks

Unlock quizzes for free by uploading documents