Typically, the sales volume declines with an increase of a product price. It has been observed, however, that for some luxury goods the sales volume may increase when the price increases. The following scatterplot illustrates this rather unusual relationship. 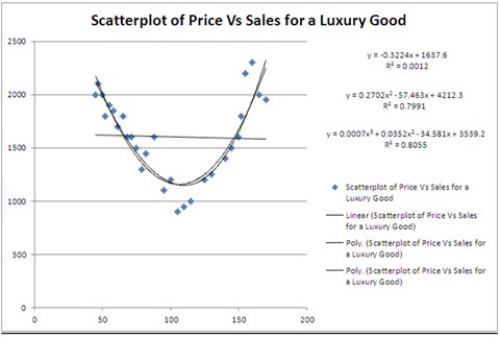 For which of the following prices do sales predicted by the quadratic regression equation reach their minimum?
A) 106.33
B) 1157.16
C) 100.41
D) 1166.64
Correct Answer:
Verified
Q37: An inverted U-shaped curve is also known
Q38: Which of the following is a quadratic
Q39: The following scatterplot shows productivity and number
Q40: The following scatterplot shows productivity and number
Q41: A model in which both the response
Q43: For the exponential model ln(y) = β0
Q44: What R function is used to fit
Q45: Typically, the sales volume declines with an
Q46: Typically, the sales volume declines with an
Q47: The coefficient of determination R2 cannot be
Unlock this Answer For Free Now!
View this answer and more for free by performing one of the following actions

Scan the QR code to install the App and get 2 free unlocks

Unlock quizzes for free by uploading documents