The following scatterplot shows productivity and number hired workers with a fitted quadratic regression model. 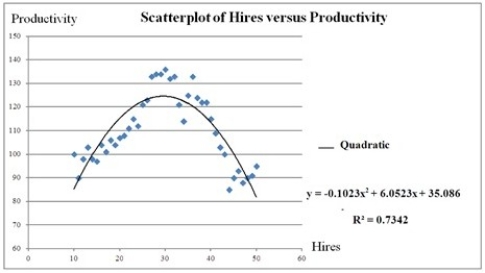 For which value of Hires is the predicted Productivity maximized? Note: Do not round to the nearest integer.
A) 29.58
B) 124.60
C) 35.086
D) 27.34
Correct Answer:
Verified
Q34: The following scatterplot shows productivity and number
Q35: Although allowing for nonlinear trends, polynomials are
Q36: The logarithmic model is especially attractive when
Q37: An inverted U-shaped curve is also known
Q38: Which of the following is a quadratic
Q40: The following scatterplot shows productivity and number
Q41: A model in which both the response
Q42: Typically, the sales volume declines with an
Q43: For the exponential model ln(y) = β0
Q44: What R function is used to fit
Unlock this Answer For Free Now!
View this answer and more for free by performing one of the following actions

Scan the QR code to install the App and get 2 free unlocks

Unlock quizzes for free by uploading documents