The figures below show plots of monthly excess returns for two stocks plotted against excess returns for a market index. 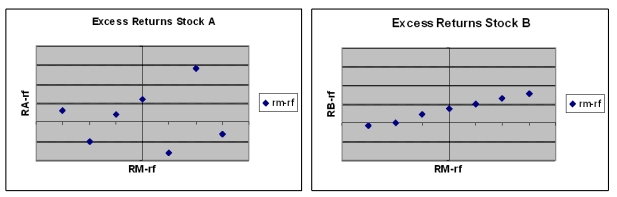
-Which stock is riskier to a non-diversified investor who puts all his money in only one of these stocks?
A) Stock A is riskier
B) Stock B is riskier
C) Both stocks are equally risky
D) You cannot tell from the information given.
Correct Answer:
Verified
Q74: The characteristic line for this stock is
Q75: The stock is _ riskier than the
Q76: Investing in two assets with a correlation
Q77: The expected return of portfolio is 8.9%
Q78: The beta of this stock is _.
A)
Q79: Which of the following correlations coefficients will
Q80: What is the standard deviation of a
Q81: The figures below show plots of monthly
Q82: A project has a 60% chance of
Q83: A project has a 50% chance of
Unlock this Answer For Free Now!
View this answer and more for free by performing one of the following actions

Scan the QR code to install the App and get 2 free unlocks

Unlock quizzes for free by uploading documents