Assume that the conductivity of a solution depends only on the total concentration of dissolved ions and that you measure the conductivity of three different solutions while performing titrations in which
I.50.00 mL of 0.100 M aqueous CH3CO2H is titrated by addition of 0.100 M NaOH.
II.50.00 mL of 0.100 M aqueous NaBr is titrated by addition of 0.100 M AgNO3.
III.50.00 mL of 0.100 M aqueous CaCl2 is titrated by addition of 0.100 M Na2CO3. 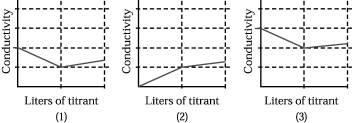
-Which of the above graphs corresponds to titration III?
A) graph (1)
B) graph (2)
C) graph (3)
D) None of the graphs
Correct Answer:
Verified
Q99: Q100: Assume that the conductivity of a solution Q101: Assume that the unshaded spheres in the Q102: How many grams of AgNO3 are needed Q103: A student left 40.0 mL of a Q105: A student prepared a stock solution by Q106: Glucose,C6H1206,can be represented by the molecular model Q107: What is the concentration of 200.mL of Q108: What is the concentration of HCl in Q109: Ascorbic acid,C6H806,can be represented by the molecular![]()
Unlock this Answer For Free Now!
View this answer and more for free by performing one of the following actions

Scan the QR code to install the App and get 2 free unlocks

Unlock quizzes for free by uploading documents