Assume that the conductivity of a solution depends only on the total concentration of dissolved ions and that you measure the conductivity of three different solutions while performing titrations in which
I.50.00 mL of 0.100 M aqueous CH3CO2H is titrated by addition of 0.100 M NaOH.
II.50.00 mL of 0.100 M aqueous NaBr is titrated by addition of 0.100 M AgNO3.
III.50.00 mL of 0.100 M aqueous CaCl2 is titrated by addition of 0.100 M Na2CO3. 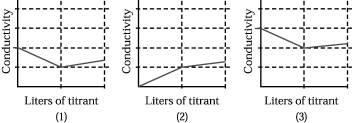
-Which of the above graphs corresponds to titration II?
A) graph (1)
B) graph (2)
C) graph (3)
D) None of the graphs
Correct Answer:
Verified
Q95: Assume that an aqueous solution of a
Q96: When 200.mL of 1.50 × 10⁻⁴ M
Q97: The following pictures represent aqueous solutions of
Q98: Which outcome corresponds to the combination of
Unlock this Answer For Free Now!
View this answer and more for free by performing one of the following actions

Scan the QR code to install the App and get 2 free unlocks

Unlock quizzes for free by uploading documents