Given the following plot of oxygen binding versus pressure of O2 for myoglobin and hemoglobin, (1)draw a curve that shows what happens when the pH is increased to about 7.6 and (2)draw a curve that shows what happens when the pH is decreased to about 6.8. 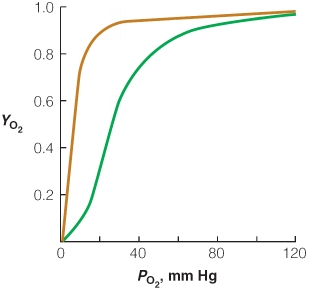
Correct Answer:
Verified
Q17: In sickle cell hemoglobin, a Glu
Q18: One would expect that defects in
Q19: The ability of some bacteria to resist
Q20: When oxygen is bound to myoglobin, the
Q21: Which of the following is the first
Q22: Which of the following methods could be
Q23: Using the following sequence from the coding
Q24: Which immunoglobulin is the only one to
Q25: 2,3-Bisphosphoglycerate is known to interact with hemoglobin
Q26: Which of the following is responsible for
Unlock this Answer For Free Now!
View this answer and more for free by performing one of the following actions

Scan the QR code to install the App and get 2 free unlocks

Unlock quizzes for free by uploading documents