A company has the data shown in the chart below concerning its forecast performance over the past four time periods. 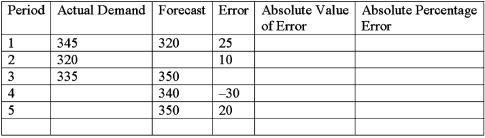 Complete the chart and compute the MAD.
A) 2
B) 20
C) 10
D) 100
Correct Answer:
Verified
Q25: In examining the data below, the manager
Q26: A company uses actual demand data to
Q28: A forecasting technique that seeks inputs from
Q30: Using the data below, determine the MAPE.
Q33: A forecasting system that changes the value
Q33: Which of the following factors should be
Q34: The tracking signal will suggest to a
Q35: Long-term/strategic demand planning is typically done using
Q35: Use the data below. Q39: Zanda Corp.has been testing the performance of![]()
Unlock this Answer For Free Now!
View this answer and more for free by performing one of the following actions

Scan the QR code to install the App and get 2 free unlocks

Unlock quizzes for free by uploading documents