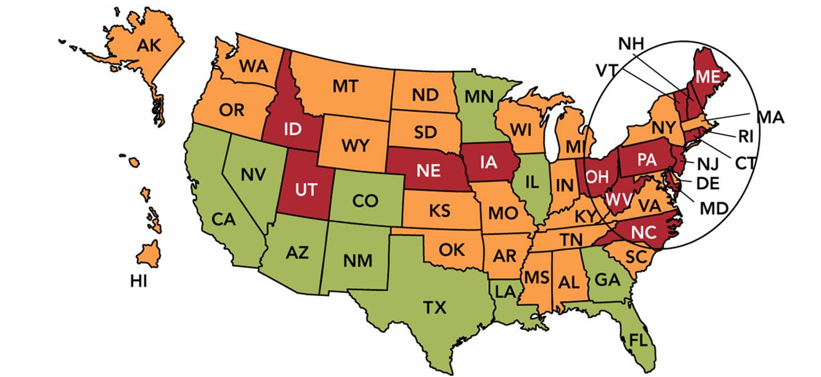
-In the UMD9: Marketing Dashboard Map above, the annual growth rate in each state is shown, with green (which looks gray on printed paper) meaning good and red (which looks black on printed paper) meaning very bad. If an organization's 2013 sales for the entire U.S. were $50 million and its 2012 U.S. sales were $30 million, what is the annual % sales change?
A) 40%
B) 67%
C) 100%
D) 125%
E) 133%
Correct Answer:
Verified
Q190: Groupthink occurs in a meeting when
A)everyone has
Q199: Marketing dashboards are useful in measuring actual
Q212: The stage of the new-product process that
Q215: The new-product process an organization goes through
Q216: The seven stages an organization goes through
Q218: If you are using a marketing dashboard
Unlock this Answer For Free Now!
View this answer and more for free by performing one of the following actions

Scan the QR code to install the App and get 2 free unlocks

Unlock quizzes for free by uploading documents