The data below show the forecasted probability of rain on election day and the actual number of people who voted in the election, for each of the past 8 years in a given city.If tomorrow is election day and the weather forecast is 50% chance of rain, how many voters do you expect to turn out? 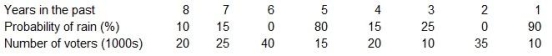
A) 28.3
B) 20.0
C) 17.4
D) 75.2
Correct Answer:
Verified
Q25: The tracking signal will suggest to a
Q37: Apply regression to the data shown below.The
Q39: Using the data below, determine the MAPE.
Q39: Zanda Corp.has been testing the performance of
Q40: A company has the data shown in
Q42: Using the data shown below, the forecast
Q43: The table below shows quarterly sales data
Q44: Demand planning for the intermediate term (tactical
Q45: Which of the following is not typically
Q46: The table below shows quarterly sales data
Unlock this Answer For Free Now!
View this answer and more for free by performing one of the following actions

Scan the QR code to install the App and get 2 free unlocks

Unlock quizzes for free by uploading documents