A company has the data shown in the chart below concerning its forecast performance over the past four time periods. 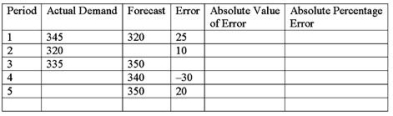 Complete the chart and compute the MAD.
A) 2
B) 20
C) 10
D) 100
Correct Answer:
Verified
Q25: The tracking signal will suggest to a
Q35: Using and exponential smoothing model, the forecast
Q37: Apply regression to the data shown below.The
Q39: Using the data below, determine the MAPE.
Q39: Zanda Corp.has been testing the performance of
Q41: The data below show the forecasted probability
Q42: Using the data shown below, the forecast
Q43: The table below shows quarterly sales data
Q44: Demand planning for the intermediate term (tactical
Q45: Which of the following is not typically
Unlock this Answer For Free Now!
View this answer and more for free by performing one of the following actions

Scan the QR code to install the App and get 2 free unlocks

Unlock quizzes for free by uploading documents