Figure 8.5 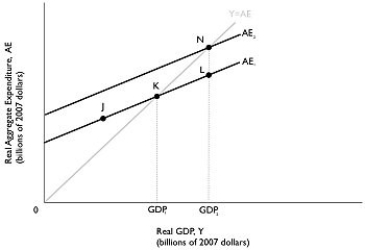 Alt text for Figure 8.5: In figure 8.5, a graph comparing real GDP and real aggregate expenditure.
Long description for Figure 8.5: The x-axis is labelled, real GDP, Y (billions of 2007 dollars) with values GDP1 and GDP2 marked.The y-axis is labelled, real aggregate expenditure, AE (billions of 2007 dollars) .Line AE1 begins a little less than half way along the x-axis and slopes up to the end of the x-axis.Line AE2 begins at a point half way along the x-axis and slopes up to the top right corner.Line AE2 is to the left of line AE1 and is on a similar path as line AE1.Line Y = AE, originates at the vertex and slopes up to the top right corner.Line Y = AE meets line AE1 at point K, half way along both lines.Line Y = AE meets the line AE2 at point N, plotted close to the right end of line AE2.Point J is marked a little less than half way along line AE1, to the left of point K.Point L is plotted close to the right end of line AE1, to the right of point K.Points K, L, and N are connected to their respective coordinates, GDP1 and GDP2, on the x-axis with dotted lines.
-Refer to Figure 8.5.Suppose that government spending increases, shifting up the aggregate expenditure line.GDP increases from GDP1 to GDP2, and this amount is $400 billion.If the MPC is 0.75, then what is the distance between N and L or by how much did government spending change?
A) $10 billion
B) $50 billion
C) $100 billion
D) $200 billion
E) $300 billion
Correct Answer:
Verified
Q221: If an increase in investment spending of
Q222: The ratio of the increase in _
Q223: Figure 8.5 Q224: If an increase in autonomous consumption spending![]()
Unlock this Answer For Free Now!
View this answer and more for free by performing one of the following actions

Scan the QR code to install the App and get 2 free unlocks

Unlock quizzes for free by uploading documents