Figure 8.5 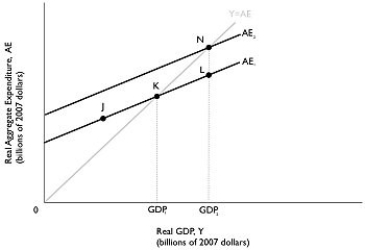 Alt text for Figure 8.5: In figure 8.5, a graph comparing real GDP and real aggregate expenditure.
Long description for Figure 8.5: The x-axis is labelled, real GDP, Y (billions of 2007 dollars) with values GDP1 and GDP2 marked.The y-axis is labelled, real aggregate expenditure, AE (billions of 2007 dollars) .Line AE1 begins a little less than half way along the x-axis and slopes up to the end of the x-axis.Line AE2 begins at a point half way along the x-axis and slopes up to the top right corner.Line AE2 is to the left of line AE1 and is on a similar path as line AE1.Line Y = AE, originates at the vertex and slopes up to the top right corner.Line Y = AE meets line AE1 at point K, half way along both lines.Line Y = AE meets the line AE2 at point N, plotted close to the right end of line AE2.Point J is marked a little less than half way along line AE1, to the left of point K.Point L is plotted close to the right end of line AE1, to the right of point K.Points K, L, and N are connected to their respective coordinates, GDP1 and GDP2, on the x-axis with dotted lines.
-Refer to Figure 8.5.Suppose that investment spending increases by $10 million, shifting up the aggregate expenditure line and GDP increases from GDP1 to GDP2.If the MPC is 0.9, then what is the change in GDP?
A) $9 million
B) $10 million
C) $90 million
D) $100 million
E) $109 million
Correct Answer:
Verified
Q217: If planned aggregate expenditure is less than
Q219: Figure 8.3 Q220: If the economy is currently in equilibrium Q221: If an increase in investment spending of Q222: The ratio of the increase in _ Q224: If an increase in autonomous consumption spending Unlock this Answer For Free Now! View this answer and more for free by performing one of the following actions Scan the QR code to install the App and get 2 free unlocks Unlock quizzes for free by uploading documents![]()

