The figure given below shows the revenue and cost curves of a firm.MC represents the marginal cost curve,AC the average cost curve,MR the marginal revenue curve,and AR the average revenue curve. Figure 8.4 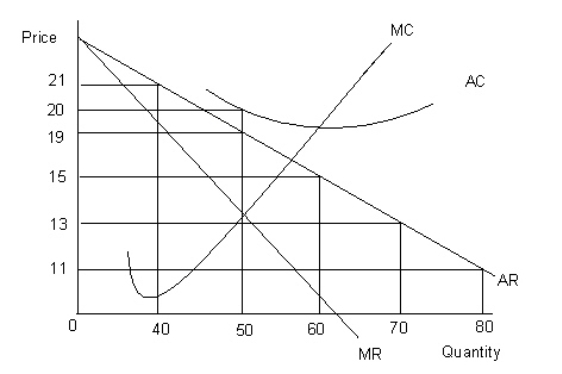
-Refer to Figure 8.4.The profit maximizing level of output is:
A) 80 units.
B) 70 units.
C) 60 units.
D) 50 units.
E) 40 units.
Correct Answer:
Verified
Q24: The table given below reports the marginal
Q39: Graphically,total cost is equal to the area
Q41: In a perfectly competitive industry,the price of
Q42: The figure given below shows the cost
Q43: Monopoly is a market structure in which:
A)there
Q46: The figure given below shows the cost
Q47: The figure given below shows the revenue
Q47: The figure given below shows the cost
Q49: The figure given below shows the revenue
Q55: The figure given below shows the revenue
Unlock this Answer For Free Now!
View this answer and more for free by performing one of the following actions

Scan the QR code to install the App and get 2 free unlocks

Unlock quizzes for free by uploading documents