The figure given below shows the cost curves of a firm. Figure 8.3 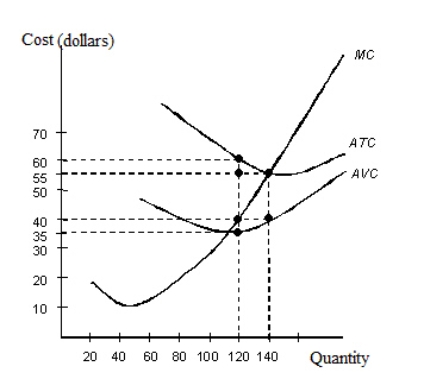
ATC: Average Total Cost
AVC: Average Variable Cost
MC: Marginal Cost
-Refer to Figure 8.3.If the firm maximizes profits at 120 units of the output,calculate the firm's marginal revenue.
A) $35
B) $40
C) $55
D) $4,200
E) Cannot be determined from the information given.
Correct Answer:
Verified
Q24: The table given below reports the marginal
Q37: The following graph shows the demand and
Q38: A producer can raise profit by expanding
Q39: Graphically,total cost is equal to the area
Q41: In a perfectly competitive industry,the price of
Q43: Monopoly is a market structure in which:
A)there
Q44: The figure given below shows the revenue
Q46: The figure given below shows the cost
Q47: The figure given below shows the revenue
Q47: The figure given below shows the cost
Unlock this Answer For Free Now!
View this answer and more for free by performing one of the following actions

Scan the QR code to install the App and get 2 free unlocks

Unlock quizzes for free by uploading documents