The following graph shows the marginal revenue (MR) and marginal cost (MC) curves of an imperfectly competitive firm. Figure 8.2 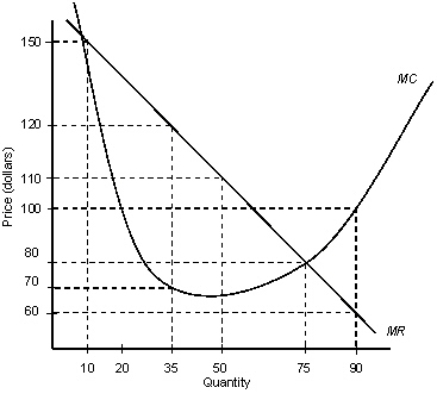
- Refer to Figure 8.2.If the current production level is 90 and the firm wishes to maximize profit,it should:
A) leave the current production level unchanged.
B) decrease the quantity produced to 75.
C) decrease the quantity produced to 50.
D) decrease the quantity produced to 35.
E) increase production until MR = MC.
Correct Answer:
Verified
Q1: The table given below reports the marginal
Q19: The table given below reports the marginal
Q21: The addition to a business firm's total
Q23: A firm enjoys a positive economic profit
Q25: The following graph shows the demand and
Q26: Graphically,profit per unit of output can be
Q27: The following graph shows the marginal revenue
Q28: If a firm's marginal revenue is greater
Q29: Suppose that Cheapo Industries,a perfectly competitive firm,currently
Q39: The table given below reports the marginal
Unlock this Answer For Free Now!
View this answer and more for free by performing one of the following actions

Scan the QR code to install the App and get 2 free unlocks

Unlock quizzes for free by uploading documents