The following graph shows the marginal revenue (MR) and marginal cost (MC) curves of an imperfectly competitive firm. Figure 8.2 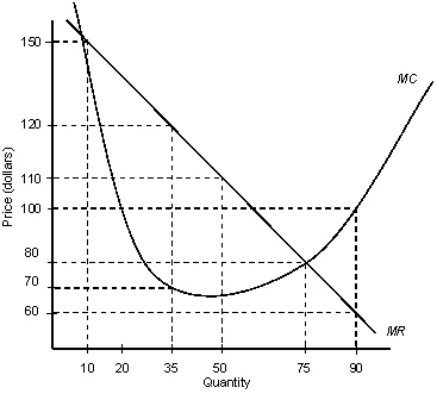
- According to Figure 8.2,the firm is maximizing profit at a quantity of _____ units.
A) 10
B) 35
C) 50
D) 75
E) 90
Correct Answer:
Verified
Q23: A firm enjoys a positive economic profit
Q24: The following graph shows the marginal revenue
Q25: The following graph shows the demand and
Q26: Graphically,profit per unit of output can be
Q28: If a firm's marginal revenue is greater
Q29: Suppose that Cheapo Industries,a perfectly competitive firm,currently
Q30: The following graph shows the demand and
Q32: The following graph shows the marginal revenue
Q37: The table given below reports the marginal
Q39: The table given below reports the marginal
Unlock this Answer For Free Now!
View this answer and more for free by performing one of the following actions

Scan the QR code to install the App and get 2 free unlocks

Unlock quizzes for free by uploading documents