The following figure shows the revenue and cost curves of a monopolist. Figure 10.3 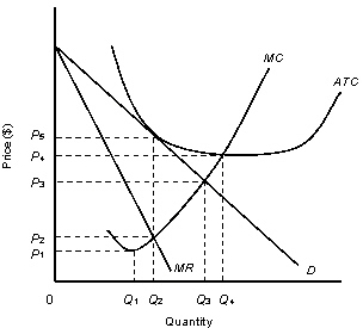
D: Average Revenue
MR: Marginal Revenue
ATC: Average Total Cost
MC: marginal Cost
-Consider the monopolist described in Figure 10.3.If the firm engages in profit-maximizing behavior,what price will it charge?
A) P1
B) P2
C) P3
D) P4
E) P5
Correct Answer:
Verified
Q44: The table given below shows the price,
Q47: To practice price discrimination,a firm:
A)must be facing
Q50: The ability of a firm to charge
Q50: The table given below shows the price,
Q51: The table given below shows the price,
Q53: Which of the following is not a
Q54: The table given below shows the prices
Q55: The table given below shows the price,
Q55: The following figure shows the revenue and
Q57: The table given below shows the price,marginal
Unlock this Answer For Free Now!
View this answer and more for free by performing one of the following actions

Scan the QR code to install the App and get 2 free unlocks

Unlock quizzes for free by uploading documents