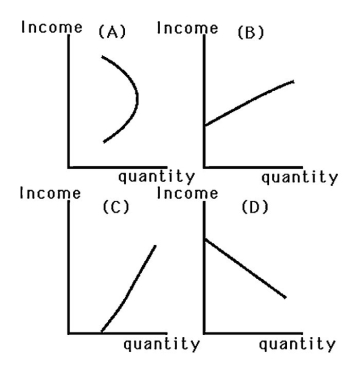
-When John's income was low,he could not afford to dine out and would respond to a pay raise by purchasing more frozen dinners.Now that his income is high,a pay raise causes him to dine out more often and buy fewer frozen dinners.Which graph in the above figure best represents John's Engel curve for frozen dinners?
A) Graph A
B) Graph B
C) Graph C
D) Graph D
Correct Answer:
Verified
Q26: After Joyce and Larry purchased their first
Q27: When deriving an Engel curve,the prices of
Q28: Q29: Explain what the slope of the income Q30: An individual derives utility from games,g (y-axis),and Q32: Q33: If consumer income and prices increase by Q34: An increase in income (all else equal)will Q35: Q36: Unlock this Answer For Free Now! View this answer and more for free by performing one of the following actions Scan the QR code to install the App and get 2 free unlocks Unlock quizzes for free by uploading documents![]()
![]()
![]()
![]()

