Multiple Choice
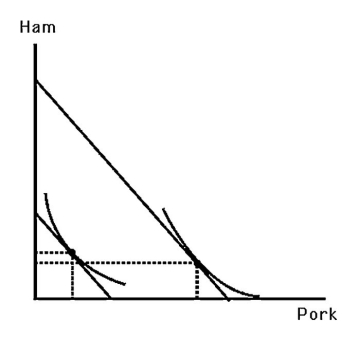
-The above figure shows Larry's indifference map and budget lines for ham and pork.Which of the following statements is TRUE?
A) Larry's demand curve for pork shifts rightward when his income increases.
B) Larry's income elasticity of demand for pork is greater than zero.
C) Pork is a normal good.
D) All of the above.
Correct Answer:
Verified
Related Questions

