The following figure shows two isocost lines ( and ) and two isoquants for the production of 200 and 350 tons of corn.The axes show the quantities of the two types of fertilizers used in corn production.
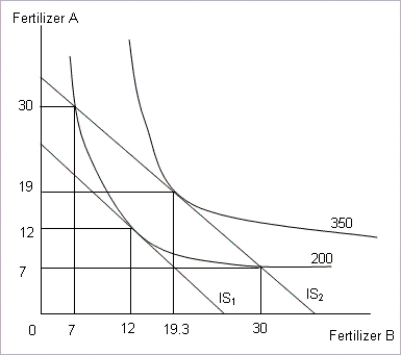
-Refer to Figure .Which of the following statements will be true?
A) No combination of fertilizers A and B on ɪs₁ can achieve a production level of 350 tons of corn.
B) All combinations of fertilizers on ɪs₂ can efficiently produce any level of output below 350 tons of corn.
C) The highest isocost ɪs₂ is more than just enough to produce 350 tons of corn.
D) The lowest isocost ɪs₁ is more than just enough to produce 200 tons of corn.
Correct Answer:
Verified
Q34:
The following figure shows two isocost
Q35:
The following figure shows the cost curves
Q36: An isocost line depicts:
A)the minimum cost required
Q37:
The following figure shows the marginal cost
Q38:
The following figure shows the cost curves
Q40: Which of the following is a property
Q41: The greater the curvature of the isoquant:
A)the
Q42:
The following figure shows three different plant
Q43: Discuss the relation between average variable cost
Q44: Which of the following cases exhibit increasing
Unlock this Answer For Free Now!
View this answer and more for free by performing one of the following actions

Scan the QR code to install the App and get 2 free unlocks

Unlock quizzes for free by uploading documents