The following figure shows the cost curves of a firm producing good X.
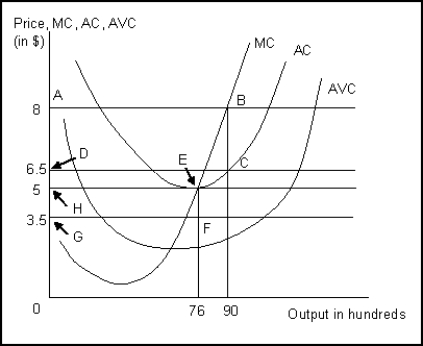
-Refer to Figure .What does the area ABCD signify?
A) The total revenue earned when the market price is $8 per unit of X.
B) The total profit earned when the market price is $8 per unit of X.
C) The total revenue earned when the market price is $5 per unit of X.
D) The total profit earned when the market price is $5 per unit of X.
Correct Answer:
Verified
Q30: The average cost of production at the
Q31: If the slope of the rays from
Q32:
The following figure shows two isocost
Q33:
The following figure shows the marginal cost
Q34:
The following figure shows two isocost
Q36: An isocost line depicts:
A)the minimum cost required
Q37:
The following figure shows the marginal cost
Q38:
The following figure shows the cost curves
Q39:
The following figure shows two isocost
Q40: Which of the following is a property
Unlock this Answer For Free Now!
View this answer and more for free by performing one of the following actions

Scan the QR code to install the App and get 2 free unlocks

Unlock quizzes for free by uploading documents