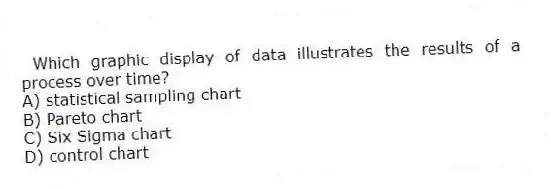
Which graphic display of data illustrates the results of a process over time?
A) statistical sampling chart
B) Pareto chart
C) Six Sigma chart
D) control chart
Correct Answer:
Verified
Q35: Which chart helps users identify the vital
Q36: Which addresses the ease of performing maintenance
Q37: The main outputs of which process are
Q38: Which five-phase improvement process do projects that
Q39: Which addresses how well a product or
Q41: Which statement is one of Deming's 14
Q42: Which is a measure of quality control
Q43: The _ ultimately decides if quality is
Q44: What term is used for a bell-shaped
Q45: Which test is done to test each
Unlock this Answer For Free Now!
View this answer and more for free by performing one of the following actions

Scan the QR code to install the App and get 2 free unlocks

Unlock quizzes for free by uploading documents