Use the figure below to answer the following questions.
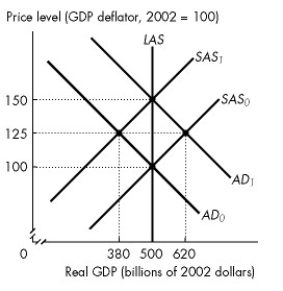
Figure 28.2.3
-Refer to Figure 28.2.3. Assume that the figure illustrates an economy initially in equilibrium at the intersection of the SAS₀ curve and the AD₀ curve. If the aggregate demand curve is expected to remain at AD₀ but shifts to AD₁, the new equilibrium real GDP is ________ and the new equilibrium price level is ________.
A) $380 billion; 125
B) $500 billion; 150
C) $500 billion; 100
D) $620 billion; 125
E) $500 billion; 125
Correct Answer:
Verified
Q38: Suppose that a severe shock that decreases
Q39: According to real business cycle theory, an
Q40: Inflation that starts because aggregate demand increases
Q41: Use the figure below to answer the
Q42: Use the figure below to answer the
Q44: A forecast based on all the relevant
Q45: Use the figure below to answer the
Q46: Use the figure below to answer the
Q47: An economy is in long-run equilibrium when
Q48: An increase in the price level due
Unlock this Answer For Free Now!
View this answer and more for free by performing one of the following actions

Scan the QR code to install the App and get 2 free unlocks

Unlock quizzes for free by uploading documents