Use the figure below to answer the following question.
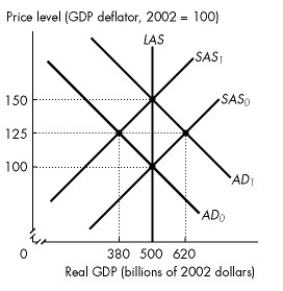
Figure 28.2.1
-Refer to Figure 28.2.1. The figure illustrates an economy initially in equilibrium at the intersection of the SAS₀ curve and the AD₀ curve. Which of the following shifts the short-run aggregate supply curve from SAS₀ to SAS₁?
A) an increase in the price of oil
B) an increase in the price level
C) an increase in the marginal product of labour
D) an increase in the demand for money
E) a decrease in the money wage rate
Correct Answer:
Verified
Q36: Which one of the following can start
Q37: Suppose that in response to a decrease
Q38: Suppose that a severe shock that decreases
Q39: According to real business cycle theory, an
Q40: Inflation that starts because aggregate demand increases
Q42: Use the figure below to answer the
Q43: Use the figure below to answer the
Q44: A forecast based on all the relevant
Q45: Use the figure below to answer the
Q46: Use the figure below to answer the
Unlock this Answer For Free Now!
View this answer and more for free by performing one of the following actions

Scan the QR code to install the App and get 2 free unlocks

Unlock quizzes for free by uploading documents