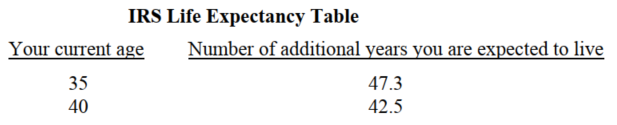
Many companies utilize life expectancy data to calculate items such as life insurance premiums or retirement benefits. The IRS is no exception. Use the data in the following table to answer the questions below.
 (Source: General American Life Insurance Company Inc.)
-Using the function you wrote in question 1, calculate the number of additional years that a 72 year-old person can expect to live. Does your graph reflect this?
Correct Answer:
Verified
View Answer
Unlock this answer now
Get Access to more Verified Answers free of charge
Q315: Find the equation of the line satisfying
Q316: Find the equation of the line satisfying
Q317: Find the inequality depicted by each
Q318: Find the inequality depicted by each
Q319: Find the domain and range of
Q320: Find the domain and range of
Q321: The graph below represents the discharge rate
Q322: Many companies utilize life expectancy data to
Q323: Many companies utilize life expectancy data to
Q325: Many companies utilize life expectancy data to
Unlock this Answer For Free Now!
View this answer and more for free by performing one of the following actions

Scan the QR code to install the App and get 2 free unlocks

Unlock quizzes for free by uploading documents