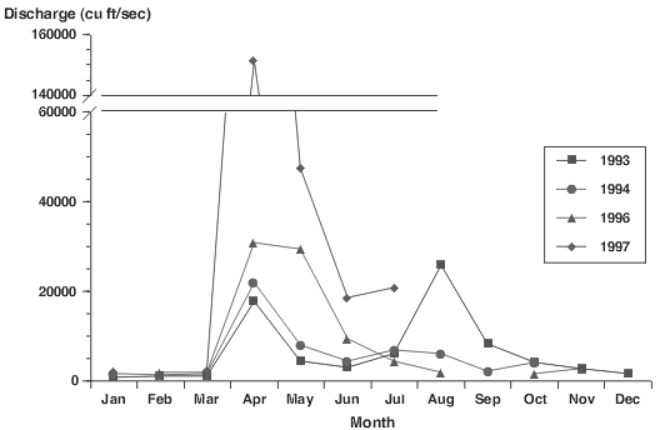
The graph below represents the discharge rate of a particular river during the years 1993, 1994, 1996, and 1997.
 (Source: www.ncsu.edu/labwrite/res)
Describe the years that are the first, second, and third highest discharge rate and any other observations that you have during the months or rates noted below.
April:________
February:_______
60,000 cubic feet/sec mark:______
July:______
August:_______
October:_________
Correct Answer:
Verified
View Answer
Unlock this answer now
Get Access to more Verified Answers free of charge
Q315: Find the equation of the line satisfying
Q316: Find the equation of the line satisfying
Q317: Find the inequality depicted by each
Q318: Find the inequality depicted by each
Q319: Find the domain and range of
Q320: Find the domain and range of
Q322: Many companies utilize life expectancy data to
Q323: Many companies utilize life expectancy data to
Q324: Many companies utilize life expectancy data to
Q325: Many companies utilize life expectancy data to
Unlock this Answer For Free Now!
View this answer and more for free by performing one of the following actions

Scan the QR code to install the App and get 2 free unlocks

Unlock quizzes for free by uploading documents