Multiple Choice
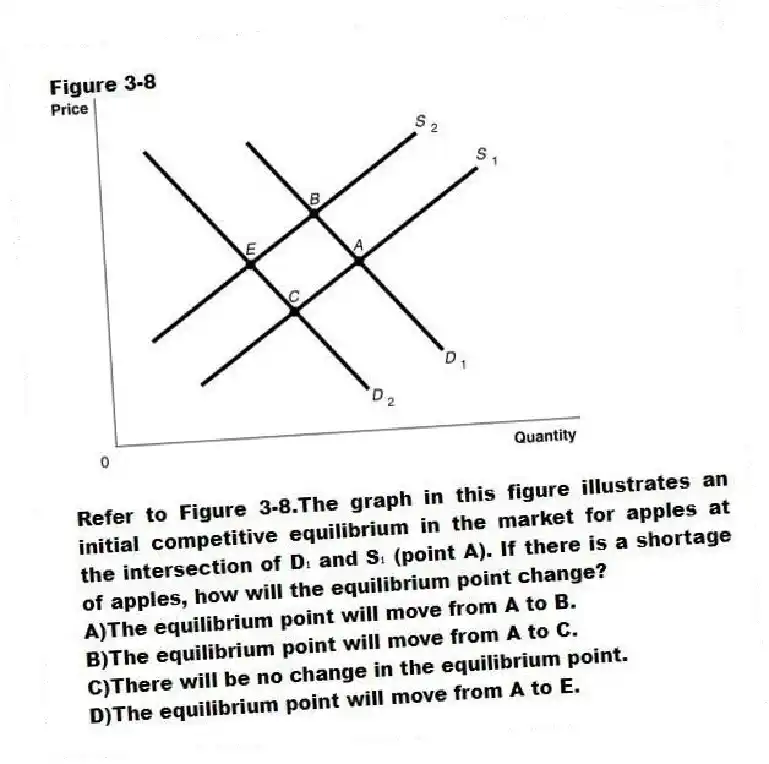
Figure 3-8

-Refer to Figure 3-8.The graph in this figure illustrates an initial competitive equilibrium in the market for apples at the intersection of D₁ and S₁ (point A) . If there is a shortage of apples, how will the equilibrium point change?
A) The equilibrium point will move from A to B.
B) The equilibrium point will move from A to C.
C) There will be no change in the equilibrium point.
D) The equilibrium point will move from A to E.
Correct Answer:
Verified
Related Questions

