Figure 3-7

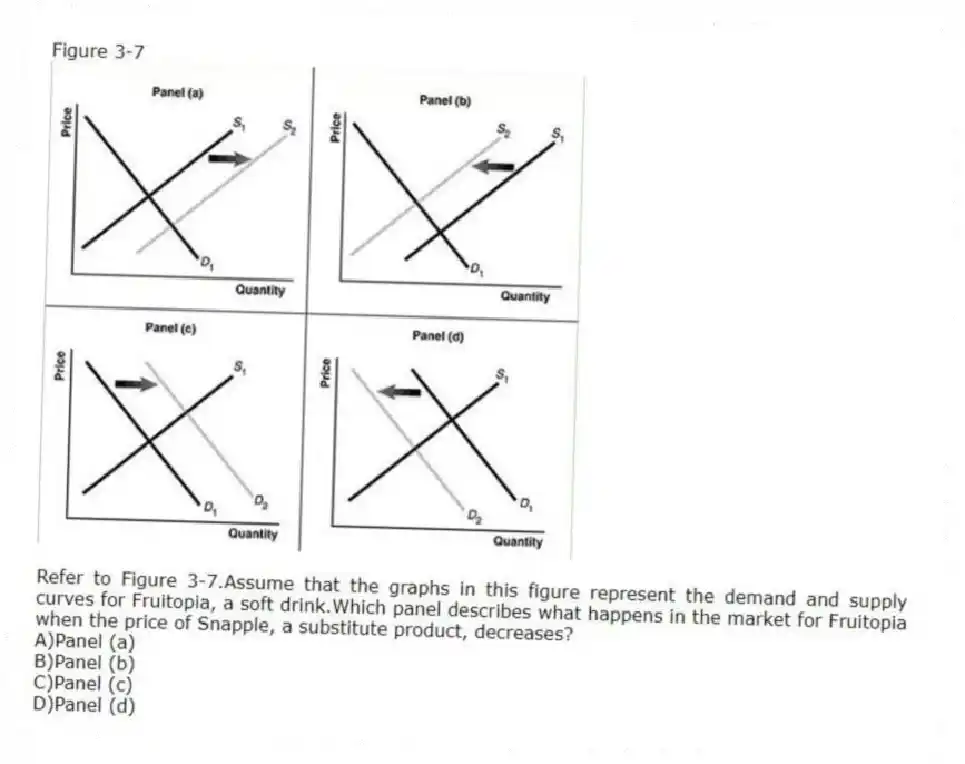
-Refer to Figure 3-7.Assume that the graphs in this figure represent the demand and supply curves for Fruitopia, a soft drink.Which panel describes what happens in the market for Fruitopia when the price of Snapple, a substitute product, decreases?
A) Panel (a)
B) Panel (b)
C) Panel (c)
D) Panel (d)
Correct Answer:
Verified
Q178: Let D = demand, S = supply,
Q179: In recent years, the cost of producing
Q180: An article in the Wall Street Journal
Q181: Figure 3-7 Q182: Figure 3-7 Q184: Assume that both the demand curve and Q185: Assume that the demand curve for MP3 Q186: An increase in input costs in the Q187: Figure 3-8 Q188: Figure 3-7 Unlock this Answer For Free Now! View this answer and more for free by performing one of the following actions Scan the QR code to install the App and get 2 free unlocks Unlock quizzes for free by uploading documents
![]()
![]()
![]()
![]()

