The provided histogram displays the prices (in thousands of dollars) of 17 homes sold between November 2011 and February 2012 in a Midwestern city.
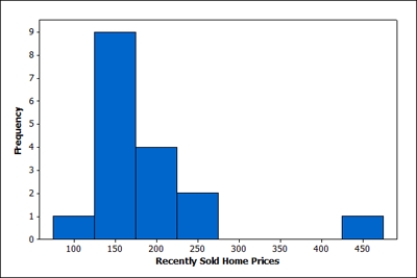
In general this shape, right skewed with some unusually high values, is common for describing home values in many cities. For this reason, the median home value for a city is a useful parameter. This sample of recently sold homes had a median price (value) of $166,500. Someone considering moving to this city is interested in knowing if the median home value is more than $150,000.
Describe how you would generate a single randomization sample in this situation, and identify the statistic you would calculate from the sample.
Correct Answer:
Verified
View Answer
Unlock this answer now
Get Access to more Verified Answers free of charge
Q55: Use the following
A study recently described
Q56: Use the following
A study recently described
Q57: Use the following
A study recently described
Q58: Use the following
In 2012 the Centers
Q59: Use the following
In 2012 the Centers
Q61: Using the definition of a p-value, explain
Q62: In a test of the hypotheses
Q63: In August 2012 Gallup reported the results
Q64: Use the following
The makers of a popular
Q65: Use the following
The makers of a popular
Unlock this Answer For Free Now!
View this answer and more for free by performing one of the following actions

Scan the QR code to install the App and get 2 free unlocks

Unlock quizzes for free by uploading documents