The following data are the speaking rates (in words per minute) of presidential candidates during televised debates in late September and early October of 2007:
Republicans:
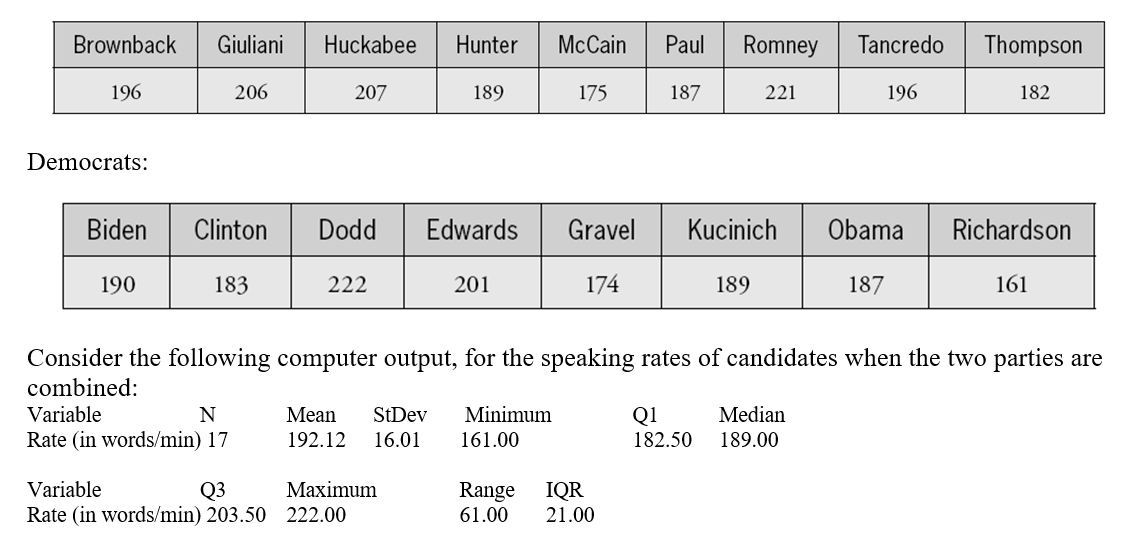
a. Use this output to determine whether there are any outliers in the data (again with the two parties combined).
The following boxplots display the speaking rates: 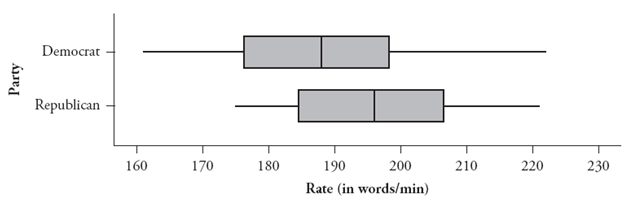 b. Report the median speaking rate for each party as accurately as you can from the graph.
c. Report the interquartile range of the speaking rates for each party as accurately as you can from the graph.
d. Summarize what these boxplots reveal about the speaking rates of the two parties' presidential candidates.
Correct Answer:
Verified
View Answer
Unlock this answer now
Get Access to more Verified Answers free of charge
Q45: The following dotplot displays the salaries
Q46: The 2001_2002 National Health and Nutrition Examination
Q47: Suppose Mary records the ages of people
Q48: Construct a hypothetical example of ten exam
Q49: In a recent study, researchers purchased 40
Q50: Suppose Ben records the noon temperature in
Q51: The following histogram displays the life expectancies
Q52: a. Construct a hypothetical example of ten
Q53: Suppose a company that has recently fired
Q55: For each of the following, indicate
Unlock this Answer For Free Now!
View this answer and more for free by performing one of the following actions

Scan the QR code to install the App and get 2 free unlocks

Unlock quizzes for free by uploading documents