The following histogram displays the life expectancies (in years), as reported by The World Almanac and Book of Facts 2006, for a sample of 22 countries: 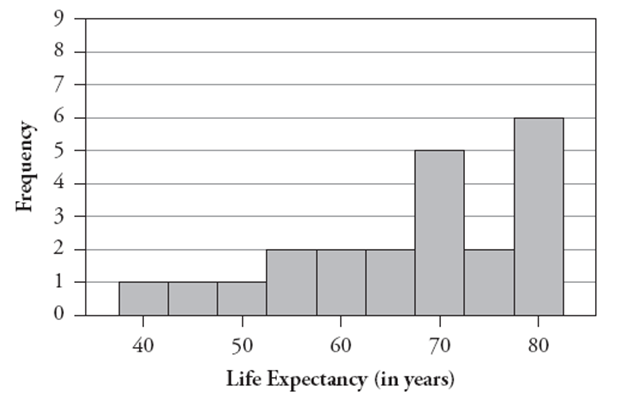
a. Describe (in five words or less) the shape of this distribution.
b. Two measures of center for this distribution are 67.0 and 70.7. One of these is the mean and the other is the median. Which is which? Explain your choice.
Now consider a histogram of the numbers of televisions per thousand people in these countries: 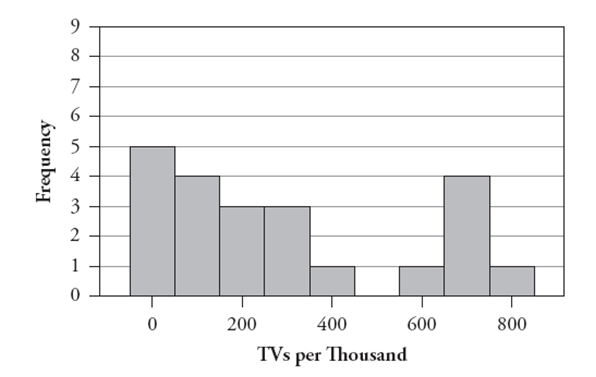 c. Write a paragraph describing key features of this distribution.
Correct Answer:
Verified
View Answer
Unlock this answer now
Get Access to more Verified Answers free of charge
Q45: The following dotplot displays the salaries
Q46: The 2001_2002 National Health and Nutrition Examination
Q47: Suppose Mary records the ages of people
Q48: Construct a hypothetical example of ten exam
Q49: In a recent study, researchers purchased 40
Q50: Suppose Ben records the noon temperature in
Q52: a. Construct a hypothetical example of ten
Q53: Suppose a company that has recently fired
Q54: The following data are the speaking rates
Q55: For each of the following, indicate
Unlock this Answer For Free Now!
View this answer and more for free by performing one of the following actions

Scan the QR code to install the App and get 2 free unlocks

Unlock quizzes for free by uploading documents