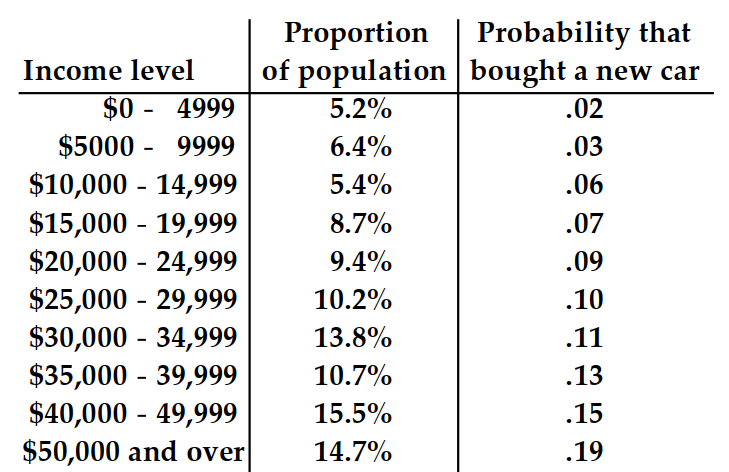
The table shows, for some particular year, a listing of several income levels and, for each level, the proportion of the population in the level and the probability that a person in that level bought a new car during the year. Given that one of the people who bought a new car during that year is randomly selected, find the probability that that person was in the indicated income category. Round your answer to the nearest hundredth.
- -
A) .05
B) .03
C) .06
D) .02
Correct Answer:
Verified
Q213: The table shows, for some particular
Q214: The table shows, for some particular
Q215: The table shows, for some particular
Q216: The table shows, for some particular
Q217: The table shows, for some particular
Q219: The table shows, for some particular
Q220: The table shows, for some particular
Q221: The table shows, for some particular
Q222: Provide an appropriate response.
-To find
Q223: Provide an appropriate response.
-Given that a
Unlock this Answer For Free Now!
View this answer and more for free by performing one of the following actions

Scan the QR code to install the App and get 2 free unlocks

Unlock quizzes for free by uploading documents