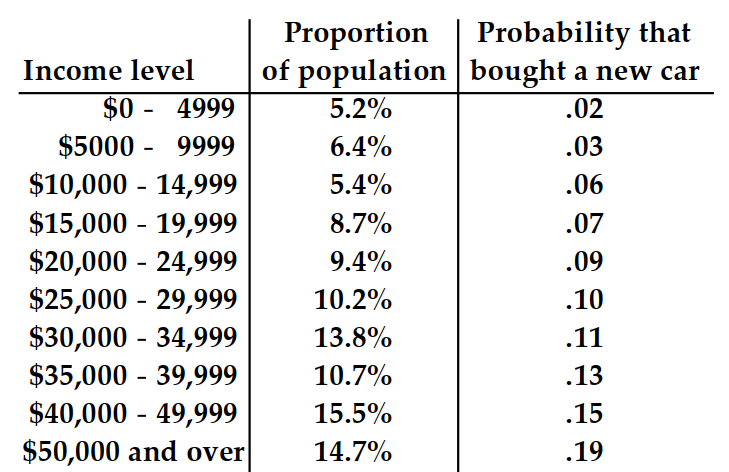
The table shows, for some particular year, a listing of several income levels and, for each level, the proportion of the population in the level and the probability that a person in that level bought a new car during the year. Given that one of the people who bought a new car during that year is randomly selected, find the probability that that person was in the indicated income category. Round your answer to the nearest hundredth.
- -
A) .04
B) .05
C) .08
D) .07
Correct Answer:
Verified
Q210: Solve the problem. Express the answer
Q211: Solve the problem. Express the answer
Q212: The table shows, for some particular
Q213: The table shows, for some particular
Q214: The table shows, for some particular
Q216: The table shows, for some particular
Q217: The table shows, for some particular
Q218: The table shows, for some particular
Q219: The table shows, for some particular
Q220: The table shows, for some particular
Unlock this Answer For Free Now!
View this answer and more for free by performing one of the following actions

Scan the QR code to install the App and get 2 free unlocks

Unlock quizzes for free by uploading documents