The following ANOVA table corresponds to an experiment on pizza preference (0-10) based on the topping (plain, sausage, pepperoni, or everything). The mean preference by groups is as follows:
Plain: 8.5
Sausage: 6.8
Pepperoni: 6.5
Everything: 2.7
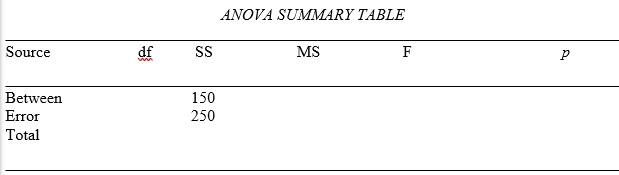 Fill in the table for a between-subjects design with a total of 6 subjects per condition, draw the graph representing the data, calculate eta-squared and Tukey's HSD, and draw conclusions based on the ANOVA table and the means provided.
Correct Answer:
Verified
HSD.05 = 5.70
HSD.01 = 7....
View Answer
Unlock this answer now
Get Access to more Verified Answers free of charge
Q11: For an F-ratio with df =
Q12: For an F-ratio with df =
Q13: For an F-ratio with df =
Q14: If a researcher reported an F-ratio with
Q15: If a researcher reported an F-ratio with
Q16: If a between-subjects ANOVA produced MSbetween =
Q17: If a between-subjects ANOVA produced MSbetween =
Q18: If a between-subjects ANOVA produced SSbetween =
Q19: Which of the following is NOT an
Q20: Calculate Tukey's HSD and eta-squared for the
Unlock this Answer For Free Now!
View this answer and more for free by performing one of the following actions

Scan the QR code to install the App and get 2 free unlocks

Unlock quizzes for free by uploading documents