Multiple Choice
Figure 50.3 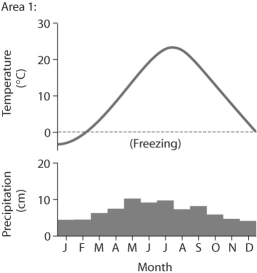
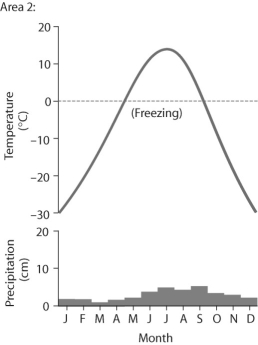
-Based on the data in the figure above,which of the following statements is false?
A) Area 1 has more average precipitation than area 2.
B) Area 1 has a higher average temperature than area 2.
C) Both areas have variation in monthly precipitation.
D) Area 2 has a smaller annual temperature variation compared to area 1.
Correct Answer:
Verified
Related Questions

