Figure 50.2 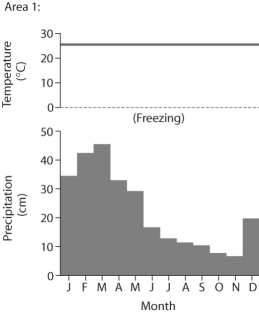
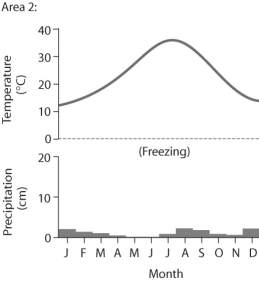
-Based on the data in Figure 50.2,which of the following statements is false?
A) Area 1 has more average precipitation than area 2.
B) Area 1 would be considered a desert because of its high average temperature.
C) Area 2 would be considered a desert because of its low average precipitation.
D) Area 2 has a large annual temperature variation.
Correct Answer:
Verified
Q5: In deep water,which of the following abiotic
Q6: Figure 50.2 Q8: Wetlands are standing bodies of freshwater, just Q8: A fish species known for its success Q11: Figure 50.3 Q12: The specific abiotic factors defining a biome Q12: Which abiotic factor would have the most Unlock this Answer For Free Now! View this answer and more for free by performing one of the following actions Scan the QR code to install the App and get 2 free unlocks Unlock quizzes for free by uploading documents
![]()
![]()

