The following figure shows a portion of a consumer's indifference map and budget lines. The price of good Y is $7 and the consumer's income is $700.
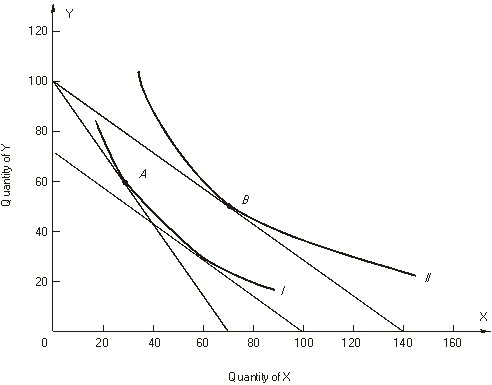 Let the consumer begin in utility maximizing equilibrium at point A on indifference curve I. Next the price of good X changes so that the consumer moves to a new utility maximizing equilibrium at point B on indifference curve II.
-Good X is a(an) ______ good.
Correct Answer:
Verified
Q42: The following figure shows a portion of
Q43: The following figure shows a portion of
Q44: The following figure shows a portion of
Q45: The following figure shows a portion of
Q46: The following figure shows a portion of
Q48: The marginal rate of substitution of X
Q49: The marginal rate of substitution of X
Q50: The marginal rate of substitution of X
Q51: A. The rate at which
Q52: Mary is consuming 3 hot dogs
Unlock this Answer For Free Now!
View this answer and more for free by performing one of the following actions

Scan the QR code to install the App and get 2 free unlocks

Unlock quizzes for free by uploading documents