The following figure shows a portion of a consumer's indifference map and budget lines. The price of good Y is $7 and the consumer's income is $700.
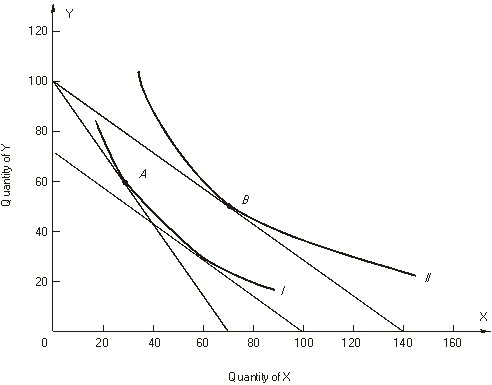 Let the consumer begin in utility maximizing equilibrium at point A on indifference curve I. Next the price of good X changes so that the consumer moves to a new utility maximizing equilibrium at point B on indifference curve II.
-Two points on this consumer's demand for good X are PX = $______ and X = ______; and PX = $______ and X = ______.
Correct Answer:
Verified
Q40: Use the following graph showing a consumer's
Q41: Use the following graph showing a consumer's
Q42: The following figure shows a portion of
Q43: The following figure shows a portion of
Q44: The following figure shows a portion of
Q46: The following figure shows a portion of
Q47: The following figure shows a portion of
Q48: The marginal rate of substitution of X
Q49: The marginal rate of substitution of X
Q50: The marginal rate of substitution of X
Unlock this Answer For Free Now!
View this answer and more for free by performing one of the following actions

Scan the QR code to install the App and get 2 free unlocks

Unlock quizzes for free by uploading documents