The following figure illustrates the labor demand curve, LD1, and labor supply curve, LS1, in the market for engineers.
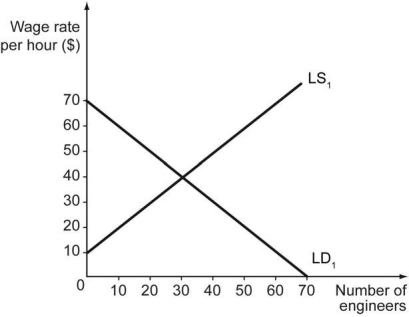 a) What are the equilibrium wage rate and employment level in the market?
b) If the government thinks that engineers are underpaid in the country and fixes a minimum wage of $50 per hour, what will be the impact on the level of employment?
c) If engineers unionize themselves and negotiate a wage that is $30 higher than the market-clearing wage, what will be the impact on the employment level?
Correct Answer:
Verified
View Answer
Unlock this answer now
Get Access to more Verified Answers free of charge
Q2: In 1973, economist Steven N. S. Cheung
Q3: The following excerpt is from Timothy R.
Q4: In episode 12 of the sixth season
Q5: What constitutes evidence for the efficacy of
Q6: The following table defines some population statistics
Q7: The following table defines some population and
Q8: Which of the following statements is true?
A)
Q9: Susan, Kevin, and Joshua are three individuals
Q10: Truck drivers across the country are on
Q11: The figure below shows labor supply and
Unlock this Answer For Free Now!
View this answer and more for free by performing one of the following actions

Scan the QR code to install the App and get 2 free unlocks

Unlock quizzes for free by uploading documents