Use the bar graph.
The bar graph shows the number of tornado reports each decade since the 1950s
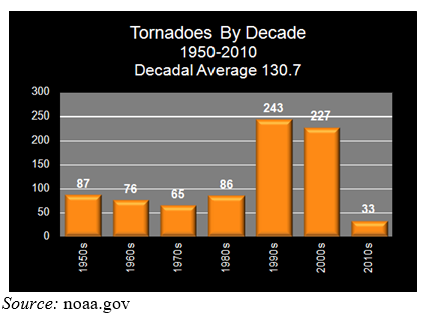
-Use roster notation to represent the range of the relation.
A) 
B) 
C) 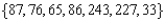
D) 
E) none of these
Correct Answer:
Verified
Q75: The function Q76: For the function Q77: For the function Q78: Use the bar graph. Q79: Use the bar graph. Q81: Use the table that shows the relationship Q82: Use the table that shows the relationship Q83: Use the table that shows the relationship Q84: Which of the relations represents a function? Q85: Select the statement that best describes the Unlock this Answer For Free Now! View this answer and more for free by performing one of the following actions Scan the QR code to install the App and get 2 free unlocks Unlock quizzes for free by uploading documents![]()
![]()
![]()
The bar graph shows
The bar graph shows

