Multiple Choice
Use the bar graph.
The bar graph shows the number of tornado reports each decade since the 1950s
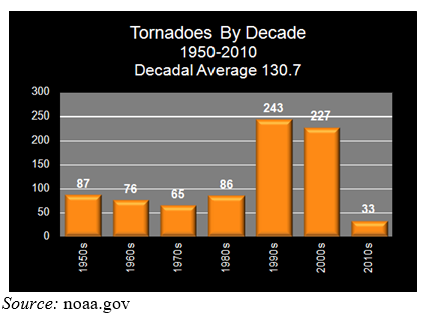
-Use roster notation to represent the correspondence between the decade (the input) and the number of tornado reportings (the output) .
A) 
B) 
C) 
D) 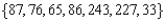
E) none of these
Correct Answer:
Verified
Related Questions
Q73: Use this information. A new company purchases
Q74: Use this information. A new company purchases

