The following table shows the size of the graduating senior class at BLE high school for several years.
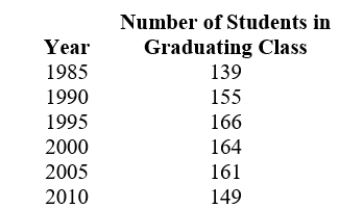
Is the average rate of change increasing, decreasing, or constant throughout?
Correct Answer:
Verified
Q25: Complete the sentence to describe the graph
Q26: Complete the sentence to describe the graph
Q27: Choose the graph that is described by
Q28: The following table shows the size of
Q29: The following table shows the size of
Q31: The following table shows the size of
Q32: The following table gives information about the
Q33: The following table gives information about the
Q34: The average costs, by year, of a
Q35: The average costs, by year, of a
Unlock this Answer For Free Now!
View this answer and more for free by performing one of the following actions

Scan the QR code to install the App and get 2 free unlocks

Unlock quizzes for free by uploading documents