The boxplots below display the distribution of maximum speed by type of roller coaster for a data set of 145 roller coasters in the United States. 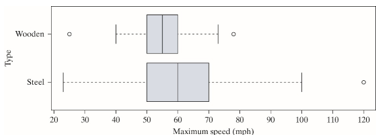
-The boxplots show that 25% of wooden roller coasters in the sample travel faster than
A) 50 mph.
B) 54 mph.
C) 60 mph
D) 65 mph.
Correct Answer:
Verified
Q9: Which of the following data sets has
Q10: The plot below displays the on-base percentage
Q11: The plot below displays the on-base percentage
Q12: The boxplots below display the distribution of
Q13: The boxplots below display the distribution of
Q15: The boxplots below display the distribution of
Q16: Do children diagnosed with attention deficit/hyperactivity disorder
Q17: Do children diagnosed with attention deficit/hyperactivity disorder
Q18: Do children diagnosed with attention deficit/hyperactivity disorder
Q19: Do children diagnosed with attention deficit/hyperactivity disorder
Unlock this Answer For Free Now!
View this answer and more for free by performing one of the following actions

Scan the QR code to install the App and get 2 free unlocks

Unlock quizzes for free by uploading documents