The plot below displays the on-base percentage for all Major League Baseball players who played in at least 15 games during the 2018 MLB season based on the player's position.
Positions: 1/2/3B = 1st/2nd/3rd base, C = catcher, C/L/RF = center/left/right field, DH = designated hitter, P = pitcher, SS = short stop
On-base percentage = (hits + walks + hit by pitch) /(total plate appearances) 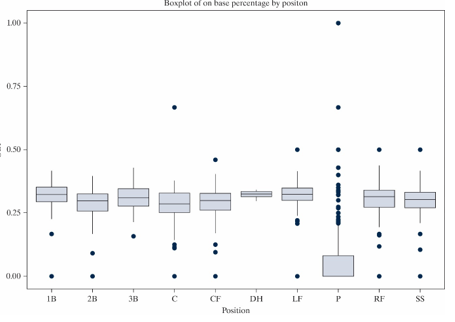
-Which of the positions has the smallest inter-quartile range (IQR) of on-base percentages?
A) 3B
B) CF
C) DH
D) P
Correct Answer:
Verified
Q5: Monthly snowfall (in inches) was measured over
Q6: Monthly snowfall (in inches) was measured over
Q7: Monthly snowfall (in inches) was measured over
Q8: Which of the following plots is not
Q9: Which of the following data sets has
Q11: The plot below displays the on-base percentage
Q12: The boxplots below display the distribution of
Q13: The boxplots below display the distribution of
Q14: The boxplots below display the distribution of
Q15: The boxplots below display the distribution of
Unlock this Answer For Free Now!
View this answer and more for free by performing one of the following actions

Scan the QR code to install the App and get 2 free unlocks

Unlock quizzes for free by uploading documents