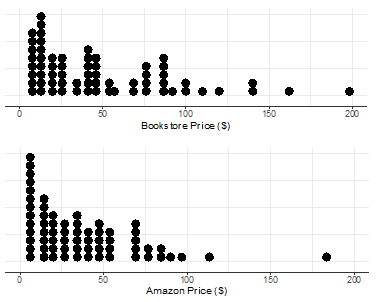
The following summary statistics and two dotplots display data on 64 used textbooks. The price of each used textbook was recorded from the University of California, Los Angeles (UCLA) campus bookstore and from Amazon. 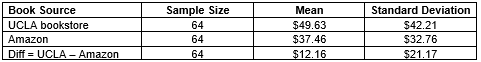
-A simulated null distribution from the Matched Pairs applet is shown below. What applet inputs should you choose to compute the p-value? 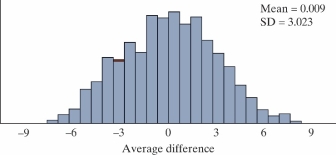 Count the proportion of samples (choose one)
A) Greater than 
B) Less than 
C) Beyond
(fill in the blank) ___________ .
Correct Answer:
Verified
Q9: Researchers randomly assigned patients with severe acne
Q10: A past statistics project investigated how well
Q11: The following summary statistics and two dotplots
Q12: The following summary statistics and two dotplots
Q13: The following summary statistics and two dotplots
Q15: The following summary statistics and two dotplots
Q16: Patients with chronic obstruction pulmonary disease (COPD)
Q17: Patients with chronic obstruction pulmonary disease (COPD)
Q18: Patients with chronic obstruction pulmonary disease (COPD)
Q19: Patients with chronic obstruction pulmonary disease (COPD)
Unlock this Answer For Free Now!
View this answer and more for free by performing one of the following actions

Scan the QR code to install the App and get 2 free unlocks

Unlock quizzes for free by uploading documents