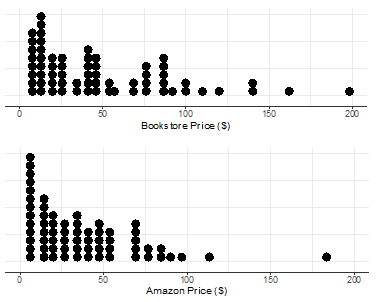
The following summary statistics and two dotplots display data on 64 used textbooks. The price of each used textbook was recorded from the University of California, Los Angeles (UCLA) campus bookstore and from Amazon. 

-If you were to create a scatterplot of the 64 textbooks, where the textbook's price at the UCLA bookstore was plotted on the x-axis, and the textbook's price on Amazon was plotted on the y-axis, what would be the value of the correlation coefficient?
A) The correlation coefficient would be positive.
B) The correlation coefficient would be negative.
C) The correlation coefficient would be near zero.
D) We are unable to determine the sign of the correlation coefficient from the information provided.
Correct Answer:
Verified
Q6: A Pew Research Center poll randomly selected
Q7: Researchers are interested in investigating the effect
Q8: Researchers randomly assigned participants who smoked but
Q9: Researchers randomly assigned patients with severe acne
Q10: A past statistics project investigated how well
Q12: The following summary statistics and two dotplots
Q13: The following summary statistics and two dotplots
Q14: The following summary statistics and two dotplots
Q15: The following summary statistics and two dotplots
Q16: Patients with chronic obstruction pulmonary disease (COPD)
Unlock this Answer For Free Now!
View this answer and more for free by performing one of the following actions

Scan the QR code to install the App and get 2 free unlocks

Unlock quizzes for free by uploading documents