College students tested to see if how well you know a person affects your ability to detect a lie from that person. To do this, they came up with 10 statements about a person in their group. Five of these statements were true and five were False. The group tried to make up statements that no-body (not even close friends) would know if they were true or False. The students then presented these statements to people that fit in three groups: close friends, acquaintances, and complete strangers and counted how many statements each person correctly identified as true or False. A summary of the results are as follows. 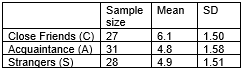
-The two graphs, A and B, show dotplots from two different data sets. Suppose I want to com-pare the means in A and do another comparison of means in B. For each case I compute an F-statistic. Which of the following will be true about these statistics? 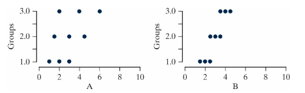
A) The F-statistic is the same in A and B.
B) The F-statistic is larger in A than in B.
C) The F-statistic is smaller in A than in B.
D) We cannot tell if the F-statistic will be larger in A or B.
Correct Answer:
Verified
Q10: The two graphs, A and B, show
Q11: College students tested to see if how
Q12: College students tested to see if how
Q13: College students tested to see if how
Q14: College students tested to see if how
Q16: When performing an ANOVA F-test, which definition
Q17: Why do you do overall tests when
Q18: As the F statistic increases, the p-value
Q19: The F statistic can be negative.
Q20: A British study examined whether the type
Unlock this Answer For Free Now!
View this answer and more for free by performing one of the following actions

Scan the QR code to install the App and get 2 free unlocks

Unlock quizzes for free by uploading documents