The two graphs, A and B, show dotplots from two different data sets. Suppose I want to com-pare the means in A and do another comparison of means in B. For each case I compute a MAD statistic. Which of the following will be true about these statistics? 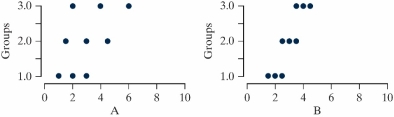
A) The MAD statistic is the same in A and B.
B) The MAD statistic is larger in A than in B.
C) The MAD statistic is smaller in A than in B.
D) We cannot tell if the MAD statistic will be larger in A or B.
Correct Answer:
Verified
Q5: In a neurological study of the effect
Q6: In a neurological study of the effect
Q7: As the Mean Group Diff statistic increases,
Q8: A simulated null distribution of the Mean
Q9: The Mean Group Diff statistic cannot be
Q11: College students tested to see if how
Q12: College students tested to see if how
Q13: College students tested to see if how
Q14: College students tested to see if how
Q15: College students tested to see if how
Unlock this Answer For Free Now!
View this answer and more for free by performing one of the following actions

Scan the QR code to install the App and get 2 free unlocks

Unlock quizzes for free by uploading documents